Project Overview
Abraxas Energy Consulting conducted a facility energy assessment (EA) project for the VA Medical Center in San Francisco, California in August 2014. There were 40 buildings in the scope of this project at the facility, 6 major and 34 minor buildings, encompassing a total of 1,022,692 square feet. The purpose of the EA program was to assist the VA Department in identifying cost effective energy and water conservation measures and thus fulfill the goal of reducing energy costs and the greenhouse gas footprint of this VA campus.
Objectives
Key project requirements were identified and are outlined below:
- Benchmark the facility and establish a consumption baseline.
- Identify and quantify energy conservation measures (ECMs) and make recommendations to reduce energy and water usage.
- Fulfill requirements and comply with all laws, executive orders, regulations, and standards related to the Energy and Water Management Program and other regulatory requirements for federal facilities.
The Solution
A site visit was required to gather information to perform the study. The on-site assessment included reviewing building and equipment data, interviewing site personnel, observing energy related equipment operation and conducting limited site measurements. Following the site visit, the energy assessment was developed in two phases.
Phase 1 consisted of a utility bill audit which established a baseline for energy and water usage and facilities benchmarking using Energy Star Portfolio Manager. Twenty-four months of bills for water, natural gas and electricity were used to conduct the audit. This generated a baseline for the energy and water usage that was later used in calculating potential energy savings. Baselines by building were also calculated for the six major buildings. These 6 buildings account for 92% and 90% of the total amount of energy and water consumed, respectively. The Energy Star score for the campus used to benchmark the facility was 74. The calculated HDDs and CDDs provided insight to potential energy conservation measures.
Phase 2 had the purpose of identifying and quantifying ECMs and WCMs. A list of 39 ECMs, categorized into different project categories, was proposed. A list of other significant findings regarding incentives, the use of cogeneration, renewable energy sources or bio-fuels, or the feasibility of a retro-commissioning study were also reported.
The Results
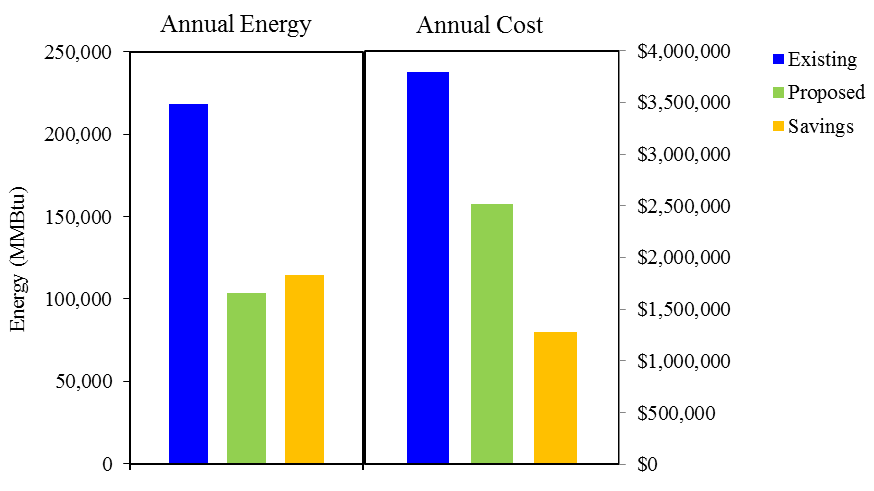
Identified ECMs were classified in several categories: air handlers, chilled water and air conditioning systems, boiler systems, exterior lighting, interior lighting, building controls, plumbing systems and water conservation, renewables and other. The largest opportunities for savings were found on replacing AHUs in some buildings, decommissioning the central steam plant and installing boilers at buildings, replacing existing interior lighting with LED tube lamps, and replacing distribution dry type transformers. Other ECMs providing large savings were instituting a steam trap management system, installing interior occupancy sensors, or using advanced metering. Studies were also conducted into the feasibility of co-generation, renewable energy sources and retro-commissioning. These were preliminary assessments and based on the results, co-generation and renewable energy sources were not found to be cost effective. A full re-commissioning of the building was recently performed by another contractor so this study proposed the evaluation of recommended measures for implementation. The existing and proposed annual energy usage and cost for this project are shown below.
Benefits
When implemented, the ECMs will save over $1,219,975 per year with a simple payback of 16.3 years. Total savings for electricity is 8,235,335 kWh/yr, for gas the savings is 1,116,825 Therm/yr, and for water savings is 403 MGal/yr. The savings estimates provided for each measure were evaluated assuming that no other measures had been implemented. In many cases, the savings for one measure overlap with another. For this reason, the total estimated energy savings provided by all of the recommendations implemented together was derated by 25% to more realistically reflect the true total savings potential. The ECMs are estimated to achieve energy savings of 53% and water savings of 1% with respect to the calculated baselines. All values were evaluated using bin simulations and spreadsheet calculations based upon standard energy savings estimating methods and known and assumed operating conditions.
Figures ES-1 presents the baseline, proposed, and savings in energy usage and costs.
Figure ES-1
Summary of Existing and Proposed Annual Energy Usage and Cost