
There are several ways to go about conducting M&V for any particular energy efficiency project. The IPVMP outlines 4 generalized approaches to M&V. To determine the best approach for each project, M&V practitioners balance accuracy of the M&V approach, the amount of projected savings, and cost to implement the approach. For example, it does not make sense to spend $10,000 a year to get a highly accurate determination of savings on a project that only saves $2000 a year. But it might make sense to spend $10,000 a year to get a highly accurate determination of savings on a project that saves $200,000 a year.
One building might have several energy efficiency projects, each of which using different M&V approaches, which are described below.
Option A: Retrofit Isolation: Partial Measurement
Retrofit Isolation refers to the fact that the energy efficiency project is isolated from the rest of the building and measurements are taken of only the retrofit. For example, a lighting project may include measures of the fixture wattages and run hours. A chiller project may include measurements of chilled water supply and return temperatures, chilled water flow rate and power consumed. Partial Measurement refers to the fact that some items may not be measured, but instead be estimated, such as lighting run hours or chilled water flow rate.
Spreadsheets are usually used to estimate savings from the measured data and assumed parameters.
In buildings with many energy efficiency projects, Retrofit Isolation will produce separate savings estimates for each different project, i.e. lighting saved x, and new chiller saved y. Sometimes, when the different energy efficiency projects interact with each other, it is difficult, if not impossible, to accurately apportion the savings associated with each project.
This method is often the lowest cost M&V approach.
Option B: Retrofit Isolation
Retrofit Isolation refers to the fact that the energy efficiency project is isolated from the rest of the building and measurements are taken of only the retrofit. For example, a lighting project may include measures of the fixture wattages and run hours. A chiller project may include measurements of chilled water supply and return temperatures, chilled water flow rate and power consumed. All inputs are measured.
Spreadsheets are usually used to estimate savings from the measured data and assumed parameters.
In buildings with many energy efficiency projects, Retrofit Isolation will produce separate savings estimates for each different project, i.e. lighting saved x, and new chiller saved y. Sometimes, when the different energy efficiency projects interact with each other, it is difficult, if not impossible, to accurately apportion the savings associated with each project.
This approach is often expensive.
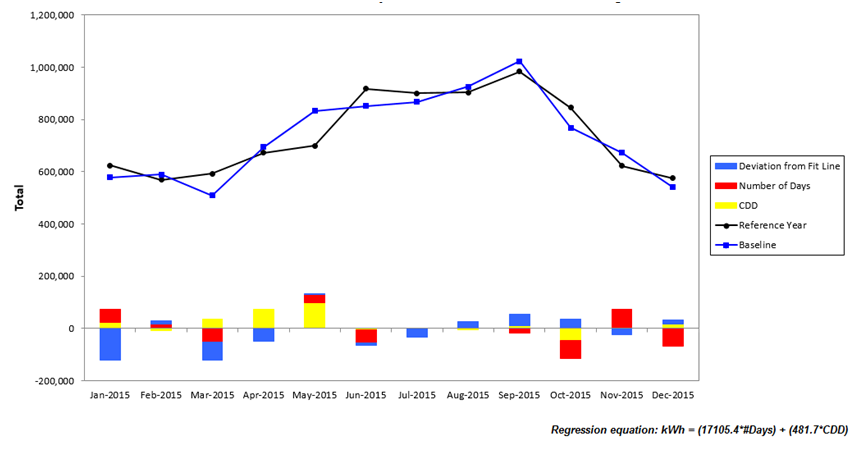
Option C: Whole Building
This approach is meter specific, rather than building specific. Utility bills, utility meter readings or submeter readings are used to determine savings. Pre-retrofit and post-retrofit measurements are compared with the difference being savings.
Because the weather changes from year to year, there will be differences in heating and cooling energy usage from year to year. Given a building that has no change in energy usage patterns, comparing utility bills may indicate that the building is “saving” energy. This can be due to changes in weather, and reduced heating and cooling needs. To remedy this problem, weather normalization is typically used to remove the effect of weather on the energy savings equation. We sell Metrix Utility Accounting System a weather normalizing software used specifically for Option C M&V.
Option C is good for projects that have many energy efficiency projects all of which interact. It becomes difficult to measure the savings explicitly using Options A and B for the different measures when they are all interacting. For example: window tinting and lighting retrofits drop the cooling load, while retro-commissioning measures change the HVAC schedules and various HVAC setpoints, and a new chiller plant increases chilled water plant efficiency.
Because there are unexplained variations in utility bills, it is commonly said that Option C should be used only if the energy efficiency projects are expected to save more than 10% of the utility meters’ usage.
Option D: Calibrated Simulation
Option D involves the taking of many field measurements and inserting them into building modeling software, such as eQUEST or Trace 700. The strength of Option D is that it can simulate the effects of changes to building envelopes, such as window tinting and white roofs. It is also a good choice for projects involving many interrelated energy efficiency projects on buildings that do not have base year bill data, such as an unmetered building on a naval base that only has a master meter.
The shortcoming of Option D is that even if model inputs are provided, there is little transparency involved and the well-known saying still applies, “junk in – junk out.” In the wrong hands, an Option D model can be made to represent anything. In inexperienced hands, the Option D model may be unreliable. It is difficult for the client to judge the accuracy of the model.