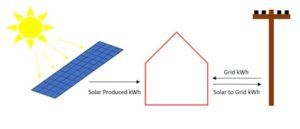
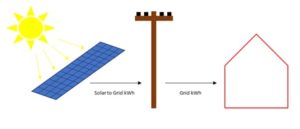
As I mentioned previously, there is not one problem but a few of them, and the answers to each will determine how you should go about addressing solar PV production in your energy savings estimations. Let’s identify them.
When Was the Solar PV System Installed? And Does the ESCO Want to Capture “Savings” Associated with the Solar PV System?
These are the first two questions we should ask. Here are some possible outcomes:
| When Was Solar Installed? | Does the ESCO Want to Capture Solar kWh Savings?[1] | Action to Take |
| Before ESP | No | The base year and performance period utility data should include the solar kWh produced, which means the solar kWh produced will cancel out, and not appear in the savings kWh number. |
| As Part of ESP | Yes | The base year utility data does not include solar, and the performance period utility data does. Savings should reflect the solar in addition to the energy efficiency projects. |
| As Part of ESP | No | Then the solar should be considered a baseline modification, or what EVO calls a non-routine adjustment. This way the baseline will have solar kWh produced and the performance period will too. The solar kWh produced will cancel out and will not appear in the savings kWh number. |
| During ESP Performance Period | No |
How Does the Utility Handles Renewable Generation?
The third question to ask is, what happens to the kWh that the solar system is creating? There are two possible answers:
How is the Utility Rate Pricing kWh?
So far, it has not been that difficult to put together this “rule book” on how to track energy savings when solar PV is involved. Tracking cost savings adds another layer of complication to the mix, and it may get uncomfortable with the added complexity.
Time of Use
If there is a TOU rate, you probably should track your usage in Metrix or Option C using TOU periods. Why? Because if the solar PV system produces more than the building uses during summer daylight hours, then the PV system is selling kWh to the grid during this TOU period. And during the evening, a different TOU period, the building may be taking power back from the building. As these TOU periods have different rates, if you do not track each TOU period kWh separately, you will be missing the difference in costs.
In the worst case, Hawaii, excess solar kWh supplied to the grid during daytime hours is worth nothing, while the power provided from the grid costs money. It is entirely possible that during a day, a particular system could provide just as much power to the grid as it takes out during evening hours, providing kWh for free, and purchasing kWh at some price.
Here is an example. Suppose during On Peak hours, your solar PV system provides 1,000 kWh to the grid, and during Off Peak hours, the grid provides 1,000 kWh back to the building. If you do not track energy separately by TOU periods, then the net kWh delivered from the grid would be:
1,000 kWh provided by Grid – 1,000 kWh provided to Grid = 0 kWh
You can apply whatever blended rate you want, it will still be $0:
0 kWh x $0.15/kWh = $0
Suppose you tracked this by TOU period, with On Peak kWh at $0.20/kWh and Off Peak kWh at $0.10/kWh. As kWh supplied to the grid during on peak is free, the total bill would be:
Total Bill = 1,000 kWh from the grid during Off Peak x $0.10/kWh = $100
Essentially, you should be tracking your usage in TOU periods and model your rates explicitly. You really should not be using a blended rate when you apply costs.[2] It appears that the best way to address solar and costing the kWh and kW is to have a rate spelled out explicitly in the contract with the client. This rate may or may not correspond to the actual rate the utility is using.[3]
While you should enter kWh by TOU periods, regressions are another matter. In this case, you are better off using sum TOU, as individual TOU period regressions often are not very good. [4] In Metrix and Option C software, you can choose to do regressions by TOU periods, or you can do a regression on the Sum of TOU periods. [5]
Do the Utilities Pay the Same Price they Pay per kWh?
Some utilities use the same rates for kWh supplied to the ratepayer and for those supplied by the ratepayer to the grid. Other utilities charge different prices for kWh supplied to the ratepayer, versus those provided by the ratepayer. This has a big effect on how you track cost savings. I am using the denotations of Rate Class 1 and Rate Class 2 in order to simplify wording in the rest of the paper. The definitions are below.
Rate Class 1: For those utilities that pay the same rates as they charge. Often you can use the net or Bill kWh when you are tracking savings.
Rate Class 2: If you are in the unenviable position of having a utility that purchases and sells electricity at different rates, then it is now much harder. Here you should not be using net or Bill kWh when you are tracking savings. Instead, you should track the kWh going to the grid and kWh coming from the grid, as they both have different costs. If for a given month you draw 1,000 kWh from the grid, and you supply 100 kWh from the grid, you will most likely be charged for 1,000 kWh at the selling price and credited 100 kWh at the buying price. The other option is that you would only be subject only to the net difference, which would be 900 kWh at the selling price, but we have not yet run across this in Rate Class 2.
Note: Many solar systems are small enough that there will never be a month in which they sell power back to the grid.[6] Even though those systems may be subject to a Class 2 Rate, they can be treated as Class 1, because they never sell kWh, and therefore, when tracking them, you will never have to calculate the cost of electricity being contributed to the grid.

