
Lesson 7: Tracking Usage in an Existing Metrix Project
We have finished laying out the Project, entering data, (and if tracking Cost Avoidance, tuning the meters). Now we are ready to track ongoing utility performance on a month-by-month basis. This is a fast and easy procedure, involving two simple steps:
Entering current data on energy use and on weather and other variables
Producing reports
It is most common to update the Project and produce reports every month, after the monthly utility bills arrive.
Entering Current Data
To track your project on an ongoing basis, once a month, enter your most recent utility bills, daily weather data, and any other variables you are using. For example, Meals Served will be entered. This information can be entered manually or imported automatically from electronic files.
In this sample Project, monthly utility bills for the two meters and weather for Mobile, Alabama will be used. We will assume this data is available in electronic format, so all that’s required is to import it each month. To streamline the tutorial, we will import several years of bill and weather data at once.
The current utility bill data is in a file named gulftrak.mt1, and the daily temperature data for Mobile, Alabama is in mobtrak.hlt:
1. From the Tools menu, choose Import Data to display the File Select dialog box.
2. From the Files of Type list, select All Files.
3. Click gulftrak.mt1 once to highlight it, then hold down the Ctrl key, and click mobtrak.hlt to select it.
4. Click OK. A dialog box indicates the import was successful. Click OK to close the dialog box.
5. To view the newly imported utility bill data, click on the Primary Elec Meter in the Tree Diagram. Then select the Register tab to display the Bill Register. You should find bills through September 1996. Click OK to close it. You can also see additional bills in the natural gas Meter.
6. To view the newly imported weather data, click on the Weather Item in the Tree Diagram. Then click on the History tab to see your Weather History data form. Weather data through September 1996, should be on the screen, as shown in Figure 2.28.
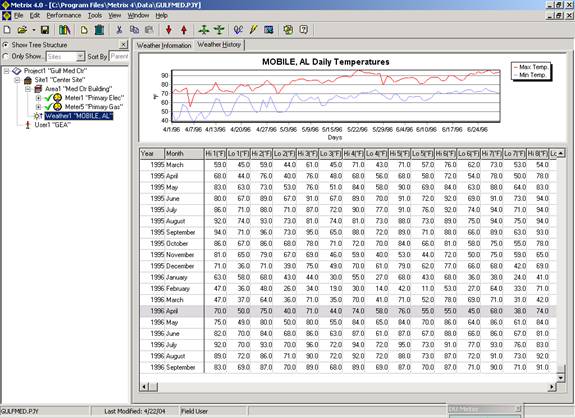
Figure 2.28: Weather History
Usually, the next thing to do in the tracking step is to generate Tracking Reports. Report making is covered in the Report Maker manual.