
Lesson 8: Reporting
Lesson 8 covers the report feature in Option C. Step-by-step report creation is demonstrated, including descriptions of some reports.
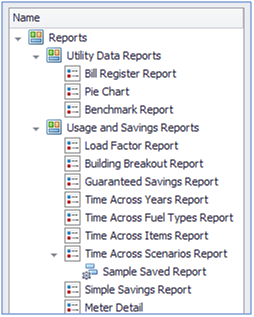
Creating Reports
Now that our project is set up, we are ready to run reports on our data.
To access the Reporting view, click the Reporting icon, in the lower left:
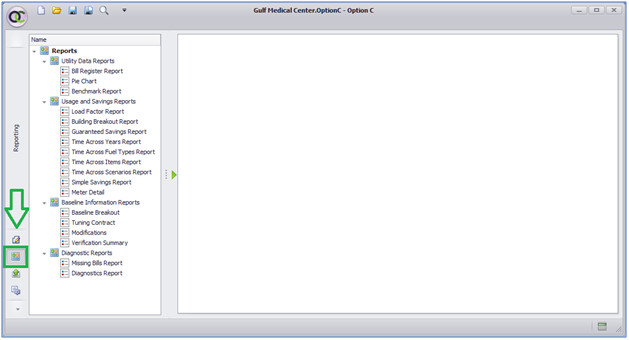
A list of reports appears in the left panel. Selecting any report will expand the central panel, where report parameters will be displayed. Report results will appear in the right panel.
Let’s create our first report:
- Under the reports list, click the ‘Time Across Scenarios’ report.
- We can now view the available report parameters in the central panel:
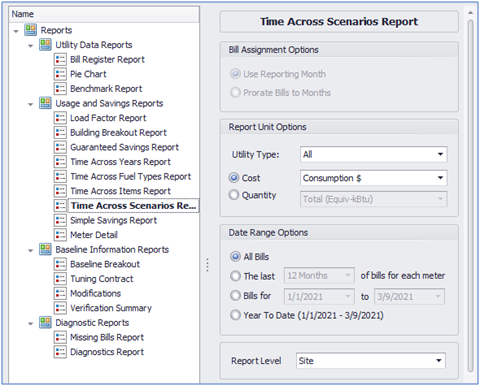
We will create a report showing Electricity kWh savings over the entire project.
3. Under Report Unit Options:
a. Click the Utility Type dropdown and select Electricity
b. Click the Quantity radio button, and select Consumption (kWh) from the dropdown menu.
4. Under Date Range Options, select All Bills.
5. Under Report Level, select Site.
6. Under Project Items Selection, leave the selection on All Sites.
7. Under Scenario, select Baseline / Actual from the dropdown menu.
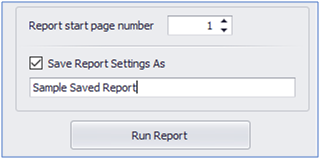
8. Leave the Report start page number as 1.
9. Click Run Report (at the bottom of the panel).
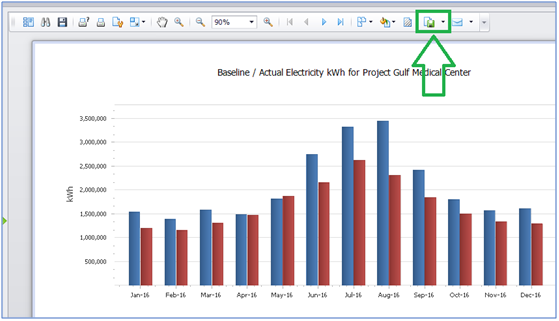
10. Our report results now appear in the right panel:
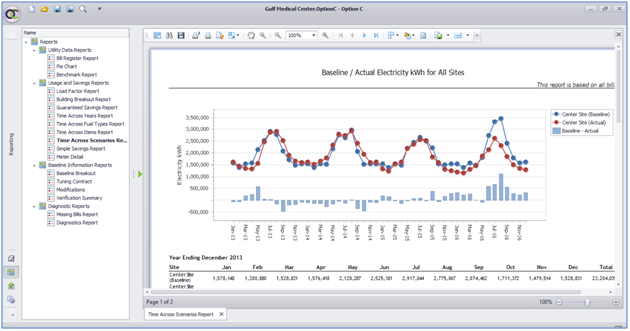
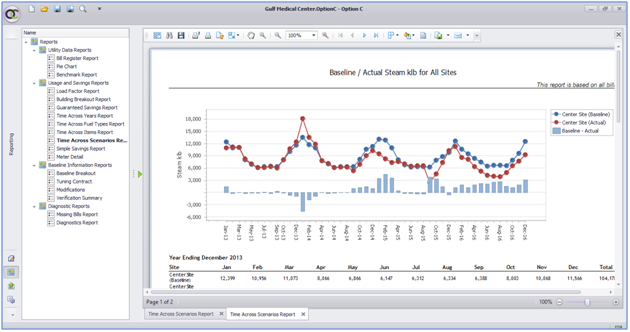
- The Report Options panel has collapsed, but can be re-expanded by clicking the green arrow that appears between the left and right panels. Our report parameters will be preserved, so this allows us to tweak or fine tune any report settings. Let’s re-run the Time Across Scenarios report for Steam, using the same parameters otherwise.
- Click the green arrow to expand the Report Options panel.
- Scroll to the top of the report options. Under Utility Type, select Steam. Quantity should remain selected, and update to Consumption (klb).
- All other parameters will remain the same. Scroll to the bottom, and click Run Report.
- Our report results now appear:
16. We now have multiple reports created. Note that a tab for each report appears at the bottom of the screen:
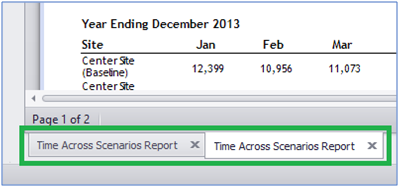
17. Created reports can be selected by clicking on their tabs. They can be deleted by clicking the ‘X’ icon on their tab.
Let’s create a new report.
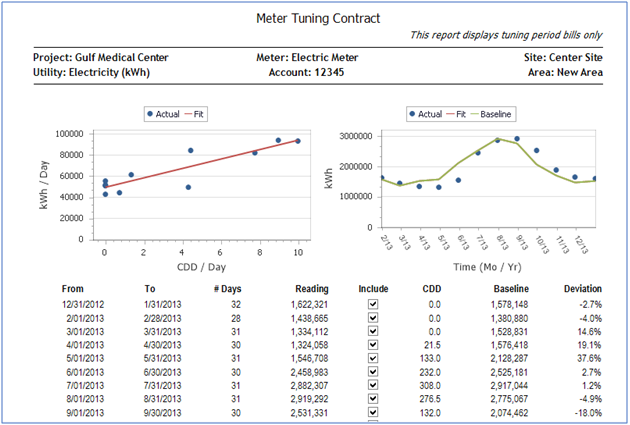
- Under the reports list, (in the left panel), select Tuning Contract report.
- Under Report Unit Options, select All.
- Under Report Level, select Meter.
- Under Project Items Selection, select All.
- Click Run Report.
- You have now created a Tuning Contract report, which will display the tuning information and baseline regression equations for all your meters:
Let’s create a final report.
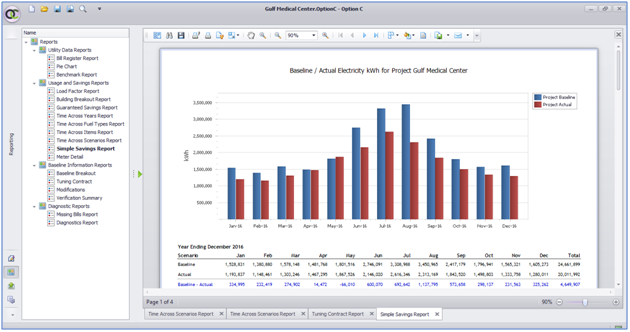
- Under the reports list, select Simple Savings report.
- Under Report Level, select Project.
- Under Scenario, select Baseline / Actual.
- Select the year ending 12/2016.
- Click Run Report.
- Your Simple Savings report results will now appear:
Saving Reports
Reports options can also be saved. This is useful when you have a frequently run report, which always uses the same options.
- Under the reports list, select the Time Across Scenarios report.
- Follow the previous steps to prepare a report for Electricity, Steam, or both utilities.
- Before clicking Run Report, click the ‘Save Report Settings As’ box, and assign a name to your report. Then click Run Report.
4. The saved report settings will now appear in the reports list, as a child item under the parent report:
5. Click the saved report in the reports list. You will see that all saved report settings appear in the middle panel.
Exporting Reports
We have now created five reports in Option C. In this next step, we will export them.
- To export our created reports, look for the Export Document icon in the toolbar at the top of the right panel:
- Click the arrow to the right of the Export Document icon. From the dropdown menu that appears, select ‘XLSX File’.
a. (Note that reports may also be exported as PDF and Images, among other file types.) - An Export Options window will appear:
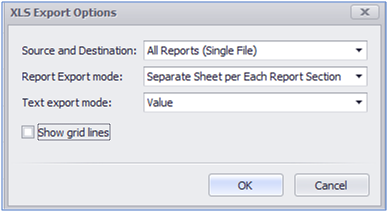
- Under Source and Destination, select All Reports (Single File).
- Under Report Export Mode, select Separate Sheet per Each Report Section.
- Under Text Export Mode, select Value.
- Leave Show grid lines unselected.
- Click Ok.
- In the Windows Explorer prompt that appears, enter a name for your reports, and choose an export destination. (You may be prompted more than once, depending on your selections.)
- In the final prompt, click Yes to open your exported reports.
These settings will export all our reports in a single Excel workbook, with one worksheet per report. By choosing different settings, we could also export a single report, export our reports into multiple Excel workbooks, or export all reports into a single Excel worksheet. Try out some of the other options to experiment.
This concludes the lesson on reporting. You may now explore the other available reports in Option C. For a full description of each report, consult the Option C Basic User’s Guide.
<--Previous lesson Next lesson–>
- Lesson 1: Getting Started in Option C
- Lesson 2: Setting up Your Option C Project
- Lesson 3: Importing Bill Data into Your Option C Project
- Lesson 4: Importing Weather Data into Your Option C Project
- Lesson 5: Tuning Your Data for Weather
- Lesson 6: Adding Measures
- Lesson 7: Adding Baseline Modifications
- Lesson 8: Reporting