
Lesson 6: Adding Measures
This lesson covers tracking savings projections, by adding Measures to your project meters.
Tracking Savings Projections
Before making changes to a facility to reduce utility costs, analysis may be performed to calculate the savings that can be achieved. For example, before replacing a lighting system with more efficient fixtures, the expected savings may be calculated, to see if the replacement is cost-effective.
These expected savings can be entered into Option C, and compared to actual savings to see if your target has been reached. This is done by creating Measures. Measures are monthly adjustments to the Baseline scenario, which create the Target scenario.
Adding Measures
In our sample Project, let’s imagine HVAC measures are implemented, which will reduce electric usage. We’ll create a measure for electric meter:
- Right click the electric meter, and select New Measure.
- A Measure item is created under the meter.
- Select the new Measure, to show the Measure Setup form.
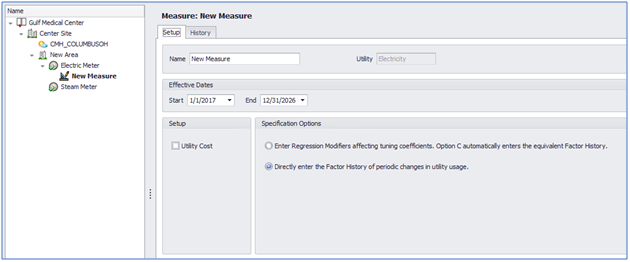
- Name the measure ‘HVAC’.
- For the effective dates, select 1/1/2014 – 12/31/2024.
- Use the ‘Specification Options’ panel to determine how the measure will be entered into your project. Select ‘Directly enter the Factor History of periodic changes in utility usage’ .
- Click the History tab. This is where projected savings are entered.
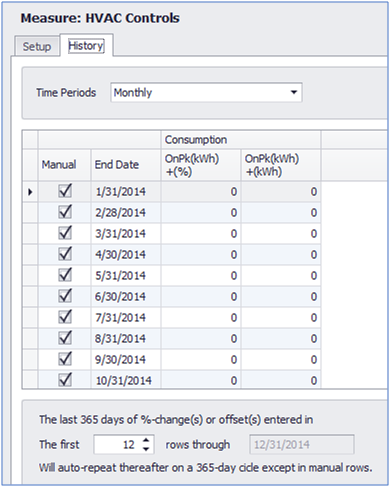
- The time periods in the register may be adjusted via the dropdown menu at the top of the form. Click the dropdown menu and select ‘Monthly’.
- The first register column OnPk (kWh) + (%) contains monthly percentage offsets for on peak quantity (kWh). For example, if –5% was entered for January, the kWh usage in the January Baseline scenario would be reduced by 5% to get the Target scenario usage. The second column OnPk (kWh) + (kWh) contains absolute monthly offsets for the usage. For example, if -1,500 were entered for January, the January Baseline scenario would be reduced by 1,500 kWh to get the Target scenario usage. (If the meter uses demand, demand columns will also appear here.)
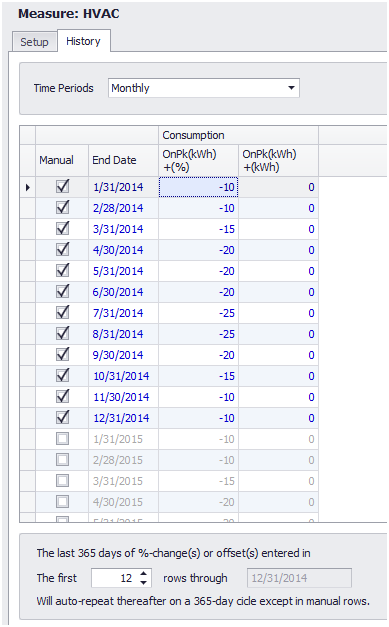
- For this example, leave 0 entered in the absolute offset column (far right), and enter the following values into the percentage offset column:
| End Date | OnPk(kWh) + (%) | OnPk(kWh) + (kWh) |
| 1/31/2014 | -10% | 0% |
| 2/28/2014 | -10% | 0% |
| 3/31/2014 | -15% | 0% |
| 4/30/2014 | -20% | 0% |
| 5/31/2014 | -20% | 0% |
| 6/30/2014 | -20% | 0% |
| 7/31/2014 | -25% | 0% |
| 8/31/2014 | -25% | 0% |
| 9/30/2014 | -20% | 0% |
| 10/31/2014 | -15% | 0% |
| 11/30/2014 | -10% | 0% |
| 12/31/2014 | -10% | 0% |
- Set the Auto-Repeat Field in the bottom left corner to 12 Rows to ensure that these values are consistently replicated on a yearly basis for the duration of the Measure.
- Your Measure should now look like Figure 6.3 below:
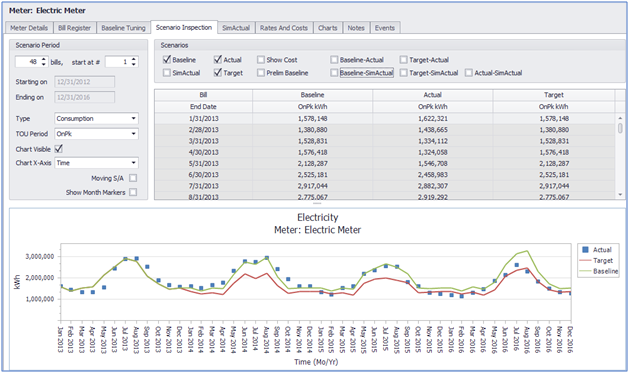
Now that you have added a Measure, select the Electric Meter and click the Scenario Inspection tab. In the Scenarios panel, select Baseline, Actual, and Target. The graph will now display the new Target scenario, in red:
That concludes this lesson. In the next, we will review the similar method for handling baseline adjustments.
<--Previous lesson Next lesson–>
- Lesson 1: Getting Started in Option C
- Lesson 2: Setting up Your Option C Project
- Lesson 3: Importing Bill Data into Your Option C Project
- Lesson 4: Importing Weather Data into Your Option C Project
- Lesson 5: Tuning Your Data for Weather
- Lesson 6: Adding Measures
- Lesson 7: Adding Baseline Modifications
- Lesson 8: Reporting